KY Transportation Cabinet Reports Alarming 2022 Work Zone Crash Stats
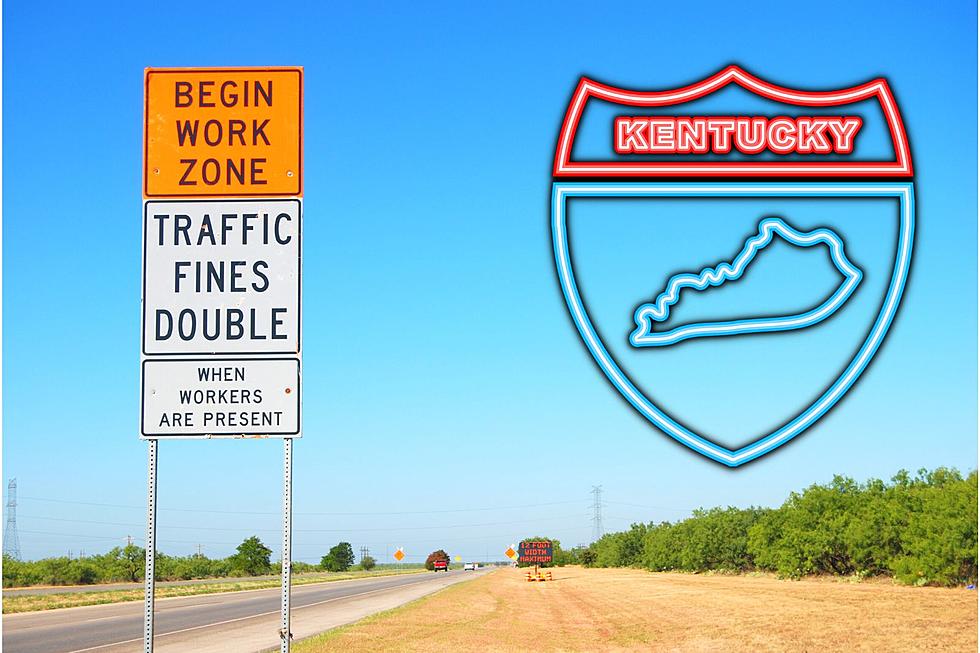
"Fines are doubled in work zones." We've seen that sign a million times and need to take it as a friendly reminder to slow down. Otherwise, we might have to deal with a not-so-friendly citation.
April 17th is the beginning of National Work Zone Awareness Week, and it's a time to remember how risky it can be for road crews to do their jobs. Sometimes, I can't drive SLOWLY enough to ensure nothing happens. I'm reminded of late last summer when extensive work was being done to reinforce bridge decks on a couple of small overpasses on Highway 231. A lot of road workers were present out of necessity, so the area was crowded with vehicles AND working pedestrians. I can't imagine anyone just flying through all that.
In 2022, according to the Kentucky Transportation Cabinet, there were 1,074 work-zone-related crashes in Kentucky that resulted in 271 injuries and six fatalities. While that number was down from 2021--a year in which there were 1,252 such accidents that resulted in 299 injuries and 10 fatalities--it's still the third-highest total of accidents since the Cabinet began keeping track of this statistic in 2006.
To reinforce the need for awareness, KYTC has been sharing a couple of videos that serve as cautionary tales. One story has a happy ending...
Sadly, one does not.
The Kentucky Transportation Cabinet reminds us that not all work zones come with barrels, cones, or barriers. These zones are also so designated when crews are mowing, fixing potholes, striping pavement, or getting rid of snow. You will, however, see flashing yellow lights or signs to indicate such activity. Often, there is what's known as a "shadow vehicle" present, as well.
There's never a reason to rush through any of these zones so quickly that you risk your own life or the lives of others. Hopefully, National Work Zone Awareness Week will serve as a reminder
LOOK: See how much gasoline cost the year you started driving
See the Must-Drive Roads in Every State
More From My WJLT 105.3


